
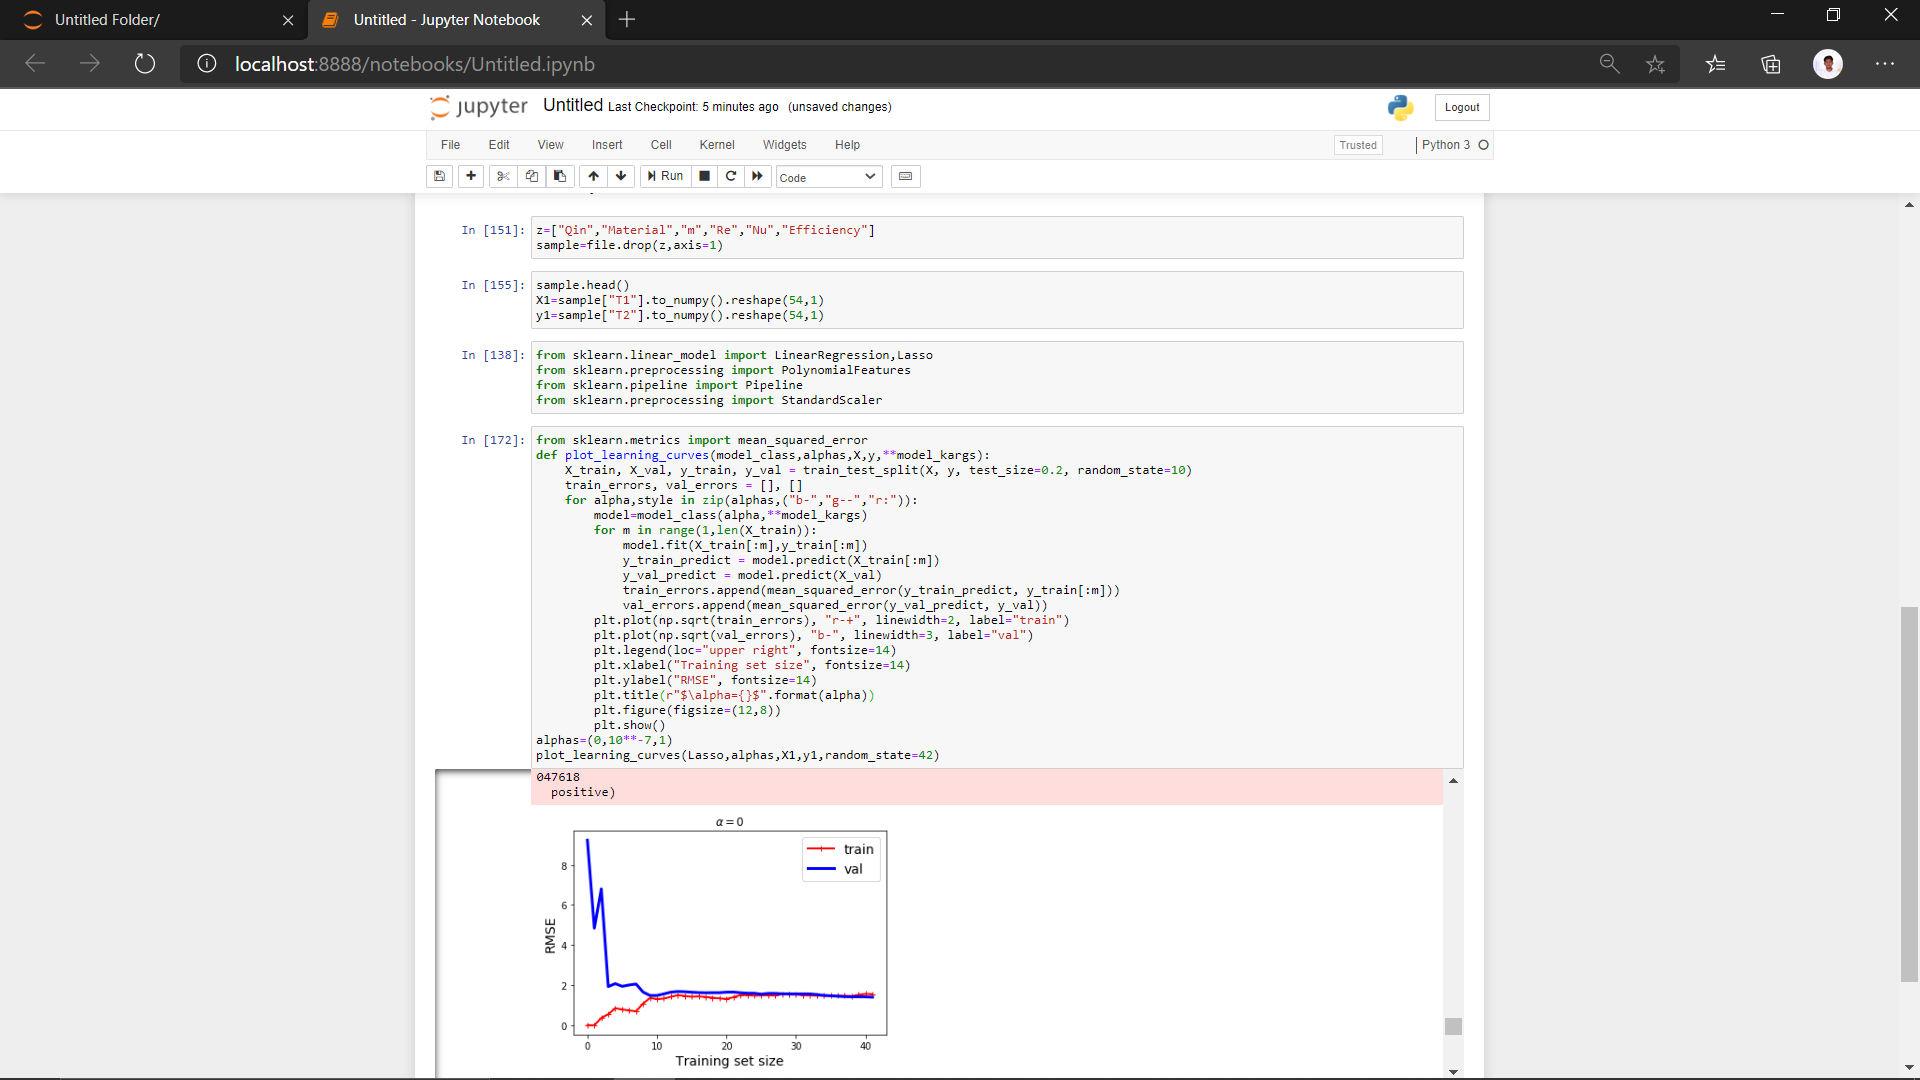

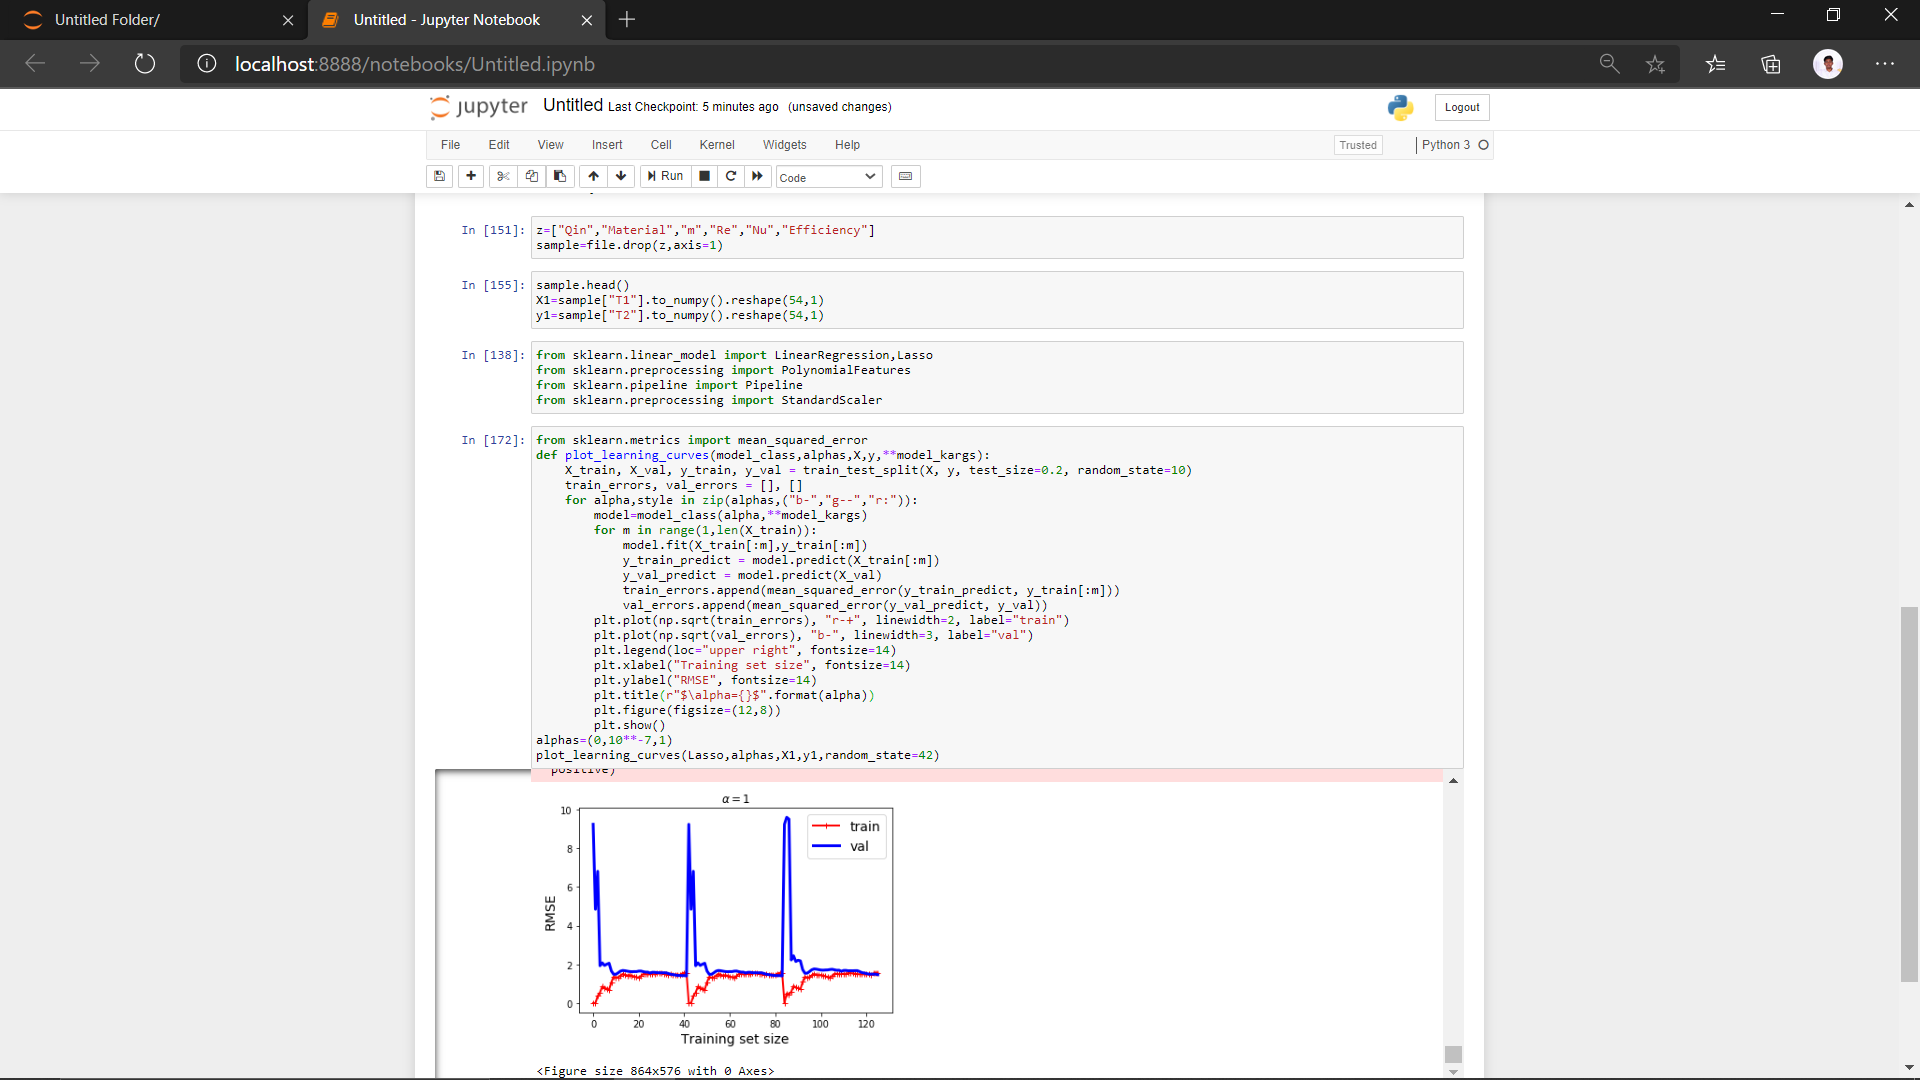
So what shall we infer from the above three graphs as we increase the value of alpha no of crest and troughs increases. So which alpha fits better and reduces overfitting or underfitting and how do you say if its underfitting or overfitting or model is doing well.?
The first graph is good. It shows that the model has learnt. The other two graphs where the validation error jumps show that the validation error jumps back to very high.
Could you try shuffling before training?