
how random sampling vvalue calculated from test set …
Hi Akanksha_Bali,
I have tried to mention everything part by part. See if it helps you understand Random Sampling Method.
Random sampling is a part of the sampling technique in which each sample has an equal probability of being chosen.
A sample chosen randomly is meant to be an unbiased representation of the total population.
This is generally fine if our dataset is large enough (especially relative to the number of attributes),
but if it is not, we run the risk of introducing a significant sampling bias. When a survey
company decides to call 1,000 people to ask them a few questions, they don’t just pick
1,000 people randomly in a phone book. They try to ensure that these 1,000 people
are representative of the whole population. For example, the US population is composed
of 51.3% female and 48.7% male, so a well-conducted survey in the US would
try to maintain this ratio in the sample: 513 female and 487 male. This is called stratified
sampling: the population is divided into homogeneous subgroups called strata,
and the right number of instances is sampled from each stratum to guarantee that the
test set is representative of the overall population. If they used purely random sampling,
there would be about 12% chance of sampling a skewed test set with either less
than 49% female or more than 54% female. Either way, the survey results would be
significantly biased.
We first divided our the income into 6 categories as in code -
housing[“income_cat”] = pd.cut(housing[“median_income”],
bins=[0., 1.5, 3.0, 4.5, 6., np.inf],
labels=[1, 2, 3, 4, 5])
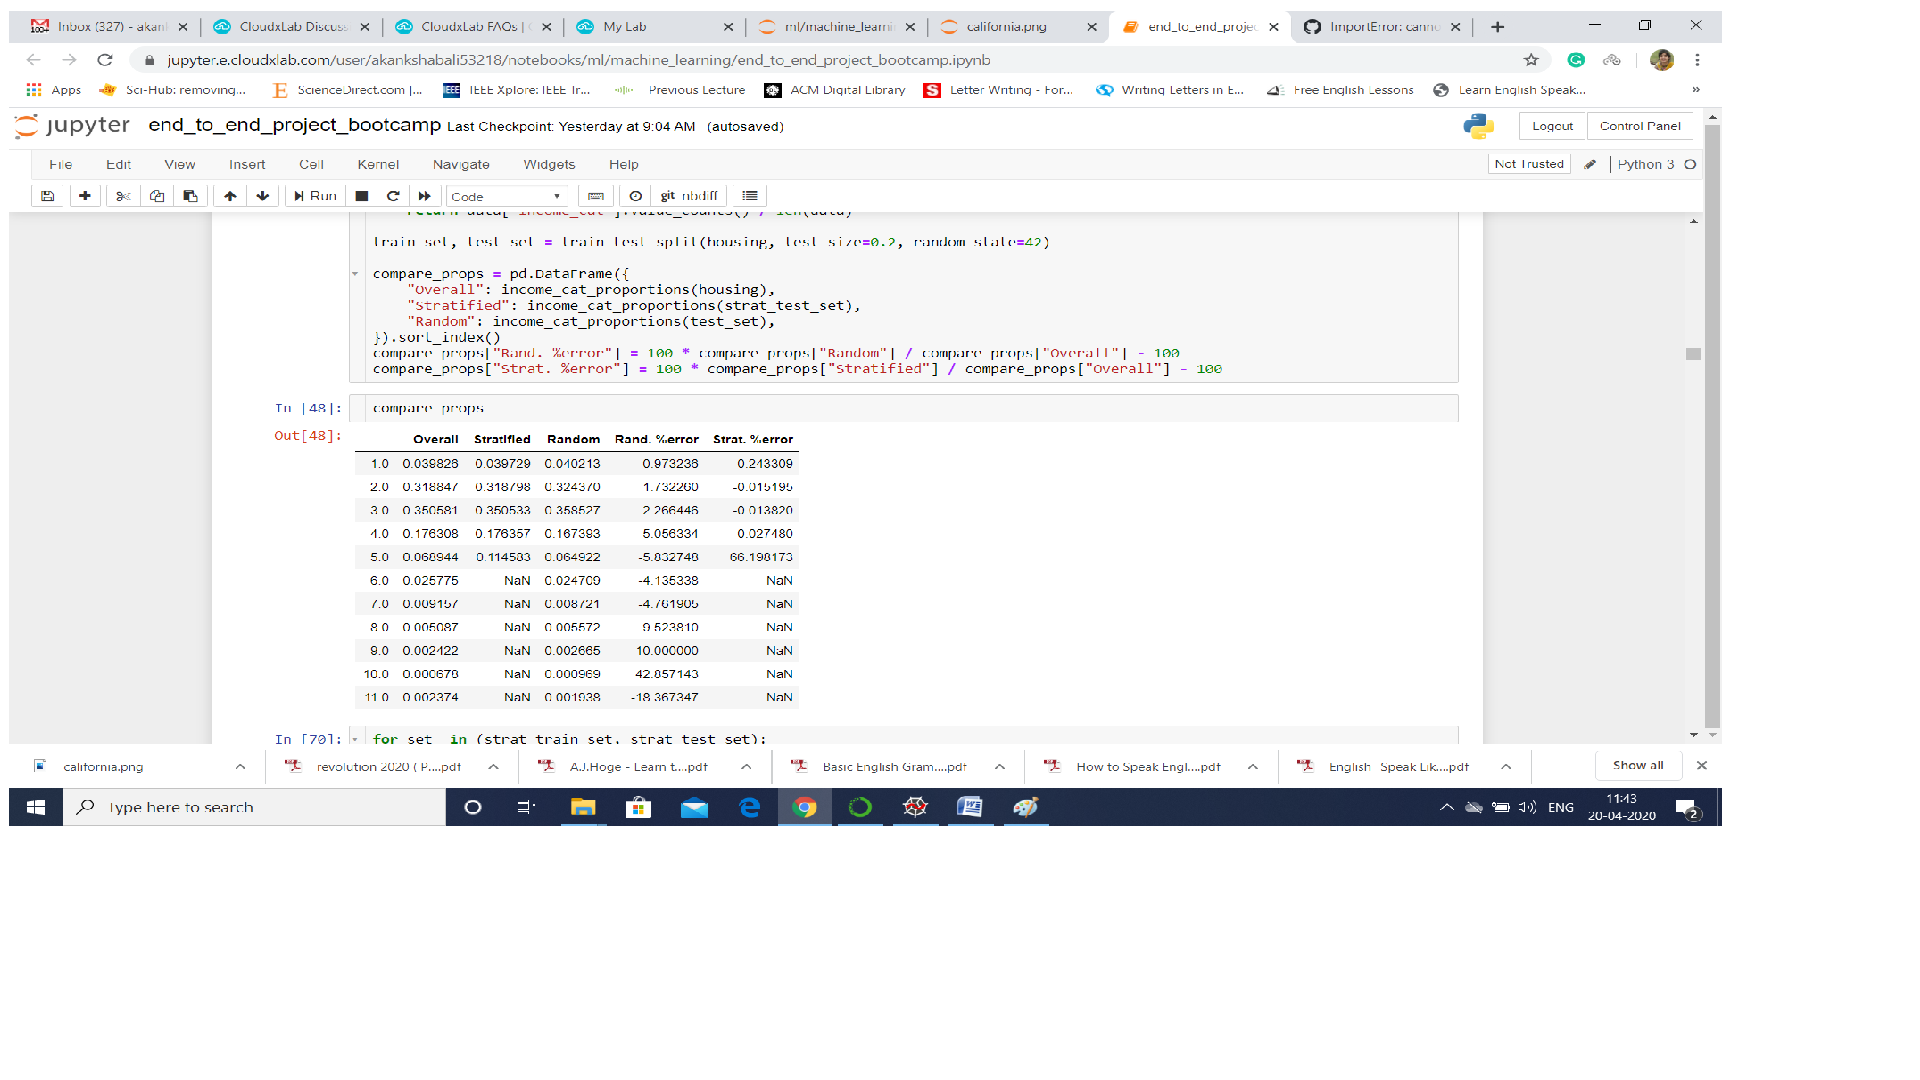
and then we calculated the income category proportion in Stratified Sampling and
on Random Sampling using the code -
compare_props[“Rand. %error”] = 100 * compare_props[“Random”] / compare_props[“Overall”] - 100
compare_props[“Strat. %error”] = 100 * compare_props[“Stratified”] / compare_props[“Overall”] - 100
We measured the income category proportions in the full dataset.
The figure generated compares the income category proportions in the overall dataset, in
the test set generated with stratified sampling, and in a test set generated using purely
random sampling. As we can see, the test set generated using stratified sampling has
income category proportions almost identical to those in the full dataset, whereas the
test set generated using purely random sampling is quite skewed.
Thanks!