CNN, Above graph is for loss and below is for accuracy,
IN CNN HOW TO REDUCE THESE FLUCTUATIONS IN THE VALUES?

CNN, Above graph is for loss and below is for accuracy,
IN CNN HOW TO REDUCE THESE FLUCTUATIONS IN THE VALUES?
(https://en.wikipedia.org/wiki/Regularization_(mathematics)#Regularization_in_statistics_and_machine_learning):
3) Increase more data or create by artificially techniques.
Is the graph in my output a good model ??? it is showing 94%accuracy.
Not a good one!
Increase the difficulty of validation set by increasing the number of images in the validation set such that Validation set contains at least 15% of training set images.
I have already used data augmentation and increased the values of augmentation making the test set difficult
So now what to do???
Kindly see if you are using Dropouts in both the train and Validations accuracy.
Dropouts will actually reduce the accuracy a bit in your case in train may be you are using dropouts and test you are not.
I am using dropouts in training set only but without using it was overfitting
You previously told that you were getting the training accuracy is 92% and validation accuracy is 99.7%.
Now you asked that you are getting 94% accuracy is this for training or validations?
In Keras architecture during the testing time the Dropout and L1/L2 weight regularization, are turned off. So no much pressure on the model during the validations time.
Only during the training time where we are training time the these regularizations comes to picture. So this results in training accuracy is less then validations accuracy.
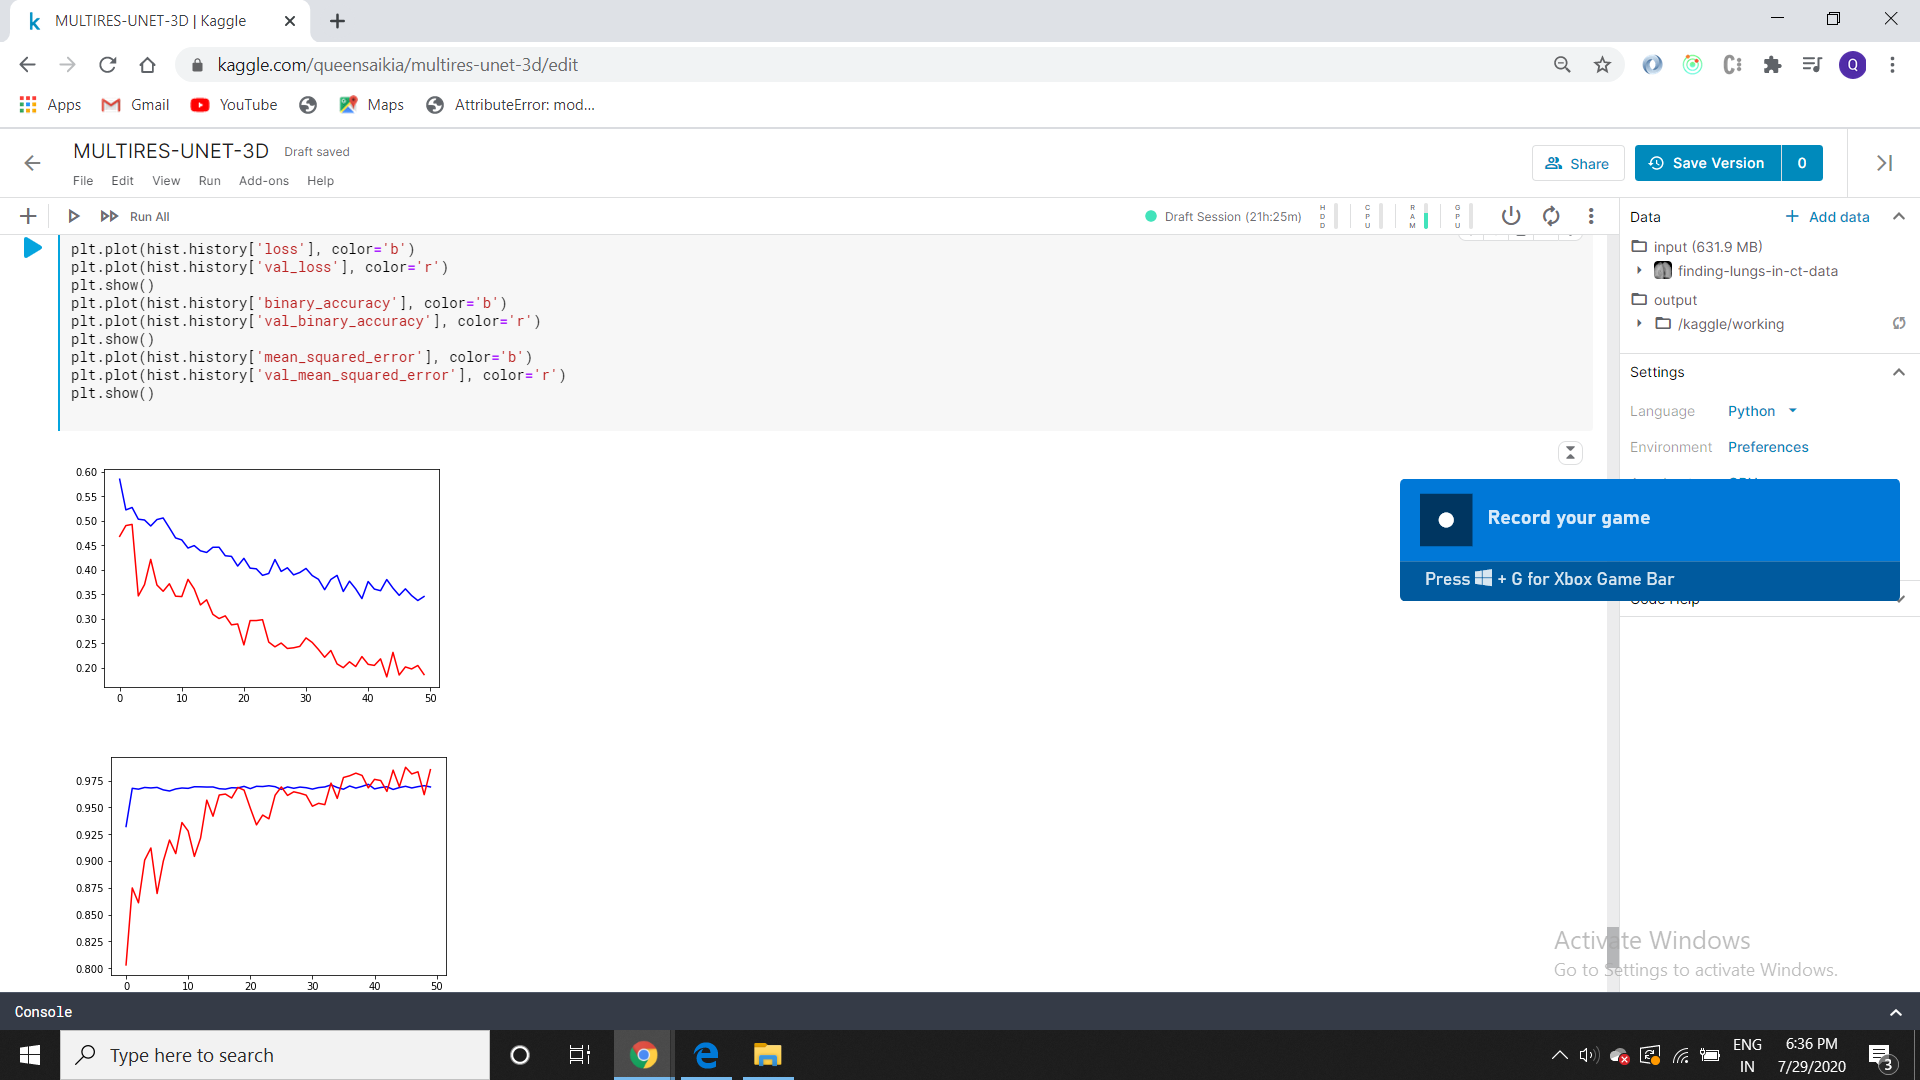
See, your loss graph is fine only the model accuracy during the validations is getting too high and overshooting to nearly 1. (That is the problem).
It can be like 92% training to 94 or 96 % testing like this.
But validation accuracy of 99.7% is does not seems to be okay.
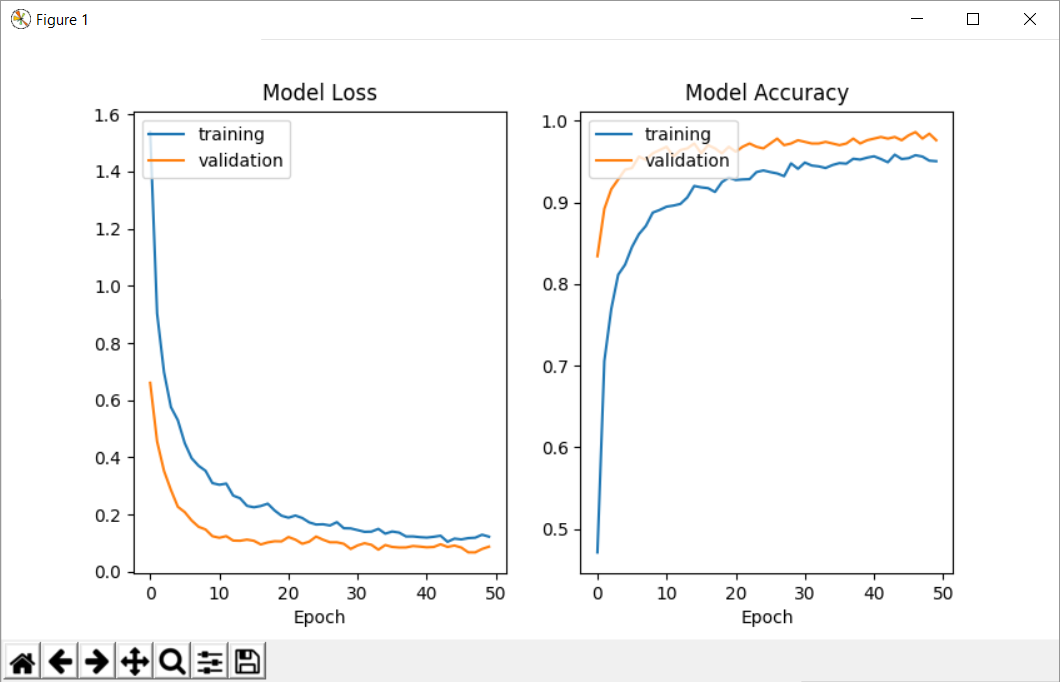
Kindly send the updated loss graphs that you are getting using the data augmentations and adding more data to the training set.
Below is the reference graph!
No, the above graph is the updated graph where training acc=97% and testing acc=94%.
I increased the values of augmentation to make the prediction more difficult so the above graph is the updated graph.
So now is it okay if training acc=97% and testing acc=94%?
Yes, training acc=97% and testing acc=94%. then it is good overall.
But the above accuracy graph if you observe it shows validation accuracy>97% in red color and training accuracy ~96% in blue color.
Still need to check with new data.
okk then May I forgot to sendd the new graph that one is the old one