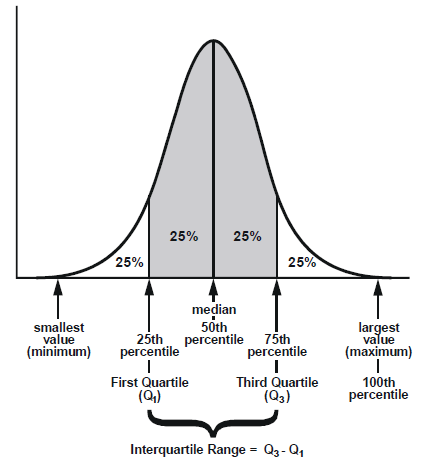
Q. What is the meaning of Inter Quantile spread?
Q. How to plot density curve?
Hi Soumyadeep,
- The IQR describes the middle 50% of values when ordered from lowest to highest. To find the interquartile range (IQR), first find the median (middle value) of the lower and upper half of the data. These values are quartile 1 (Q1) and quartile 3 (Q3). The IQR is the difference between Q3 and Q1. Here is a plot describing the same.

- Here is a link to an article explaining all about Plotting Density Curves in Python using Seaborn Library.
Histograms and Density Plots in Python
I hope it helps
Regards.
